The skeleton.
Hollow amber wireframe on absolute black. Every edge describes structure; the space between stays empty.
Read Standard ↗Download specification ↓
Gridcore is an experiment in making the underlying shape of things visible.
Developed as the visual language of Globe & Atlas, Gridcore is also at home here in the Labs: a specification to explore, test, and put to work.
Its starting point is simple. Strip away texture, lighting, and decoration until the geometry can speak for itself.
Specification on GitHub ↗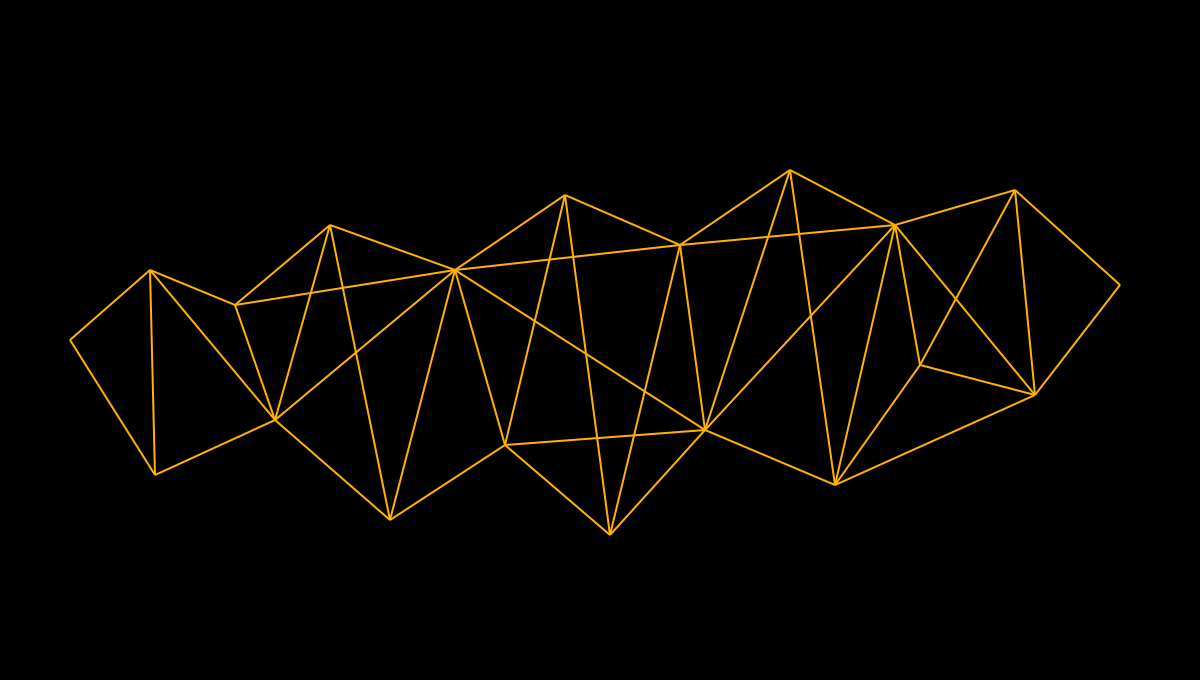
A few ways to put the language to work. These original concept illustrations explore the four modes; the written specifications remain the reference for their rules.
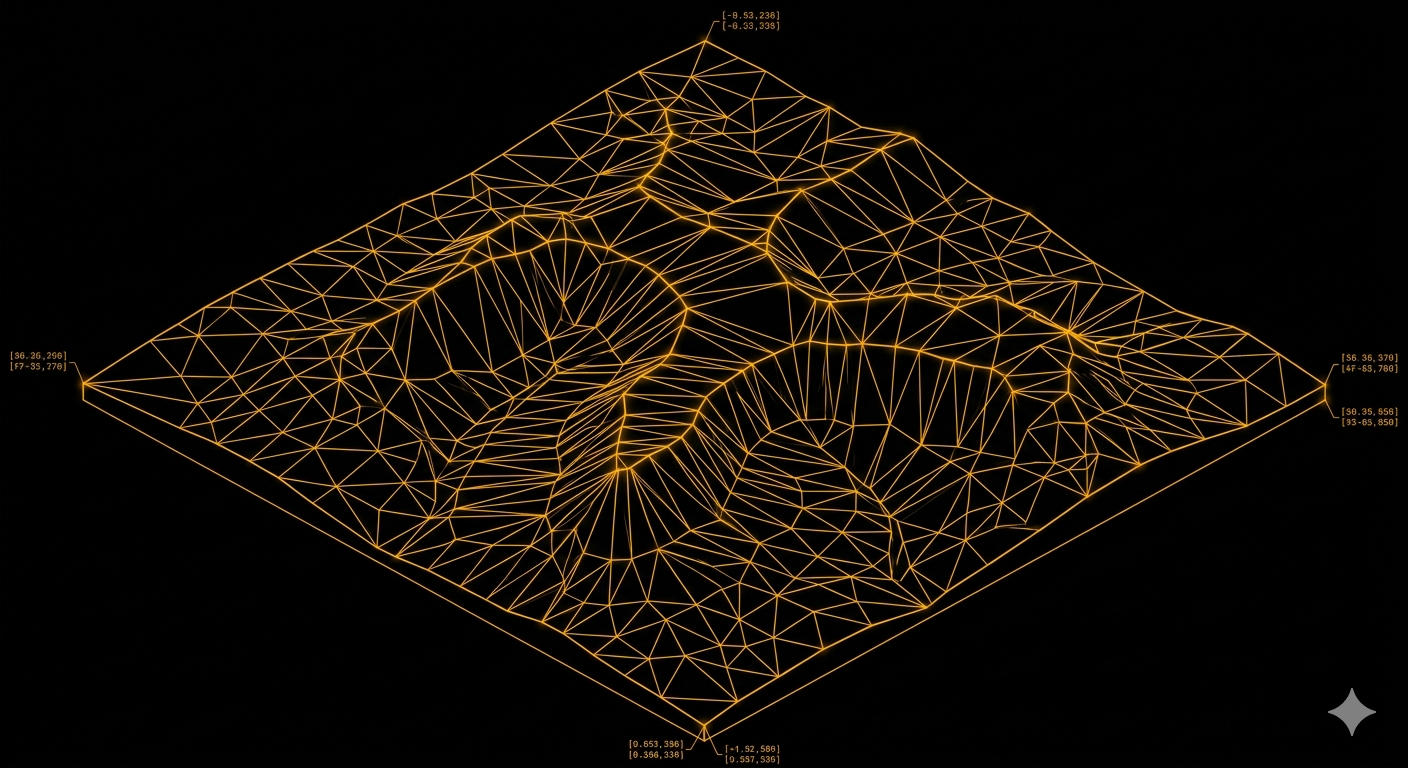
A landscape reduced to its structural mesh. Ridges, valleys, and changes in relief emerge through amber edges alone.
View full-size image ↗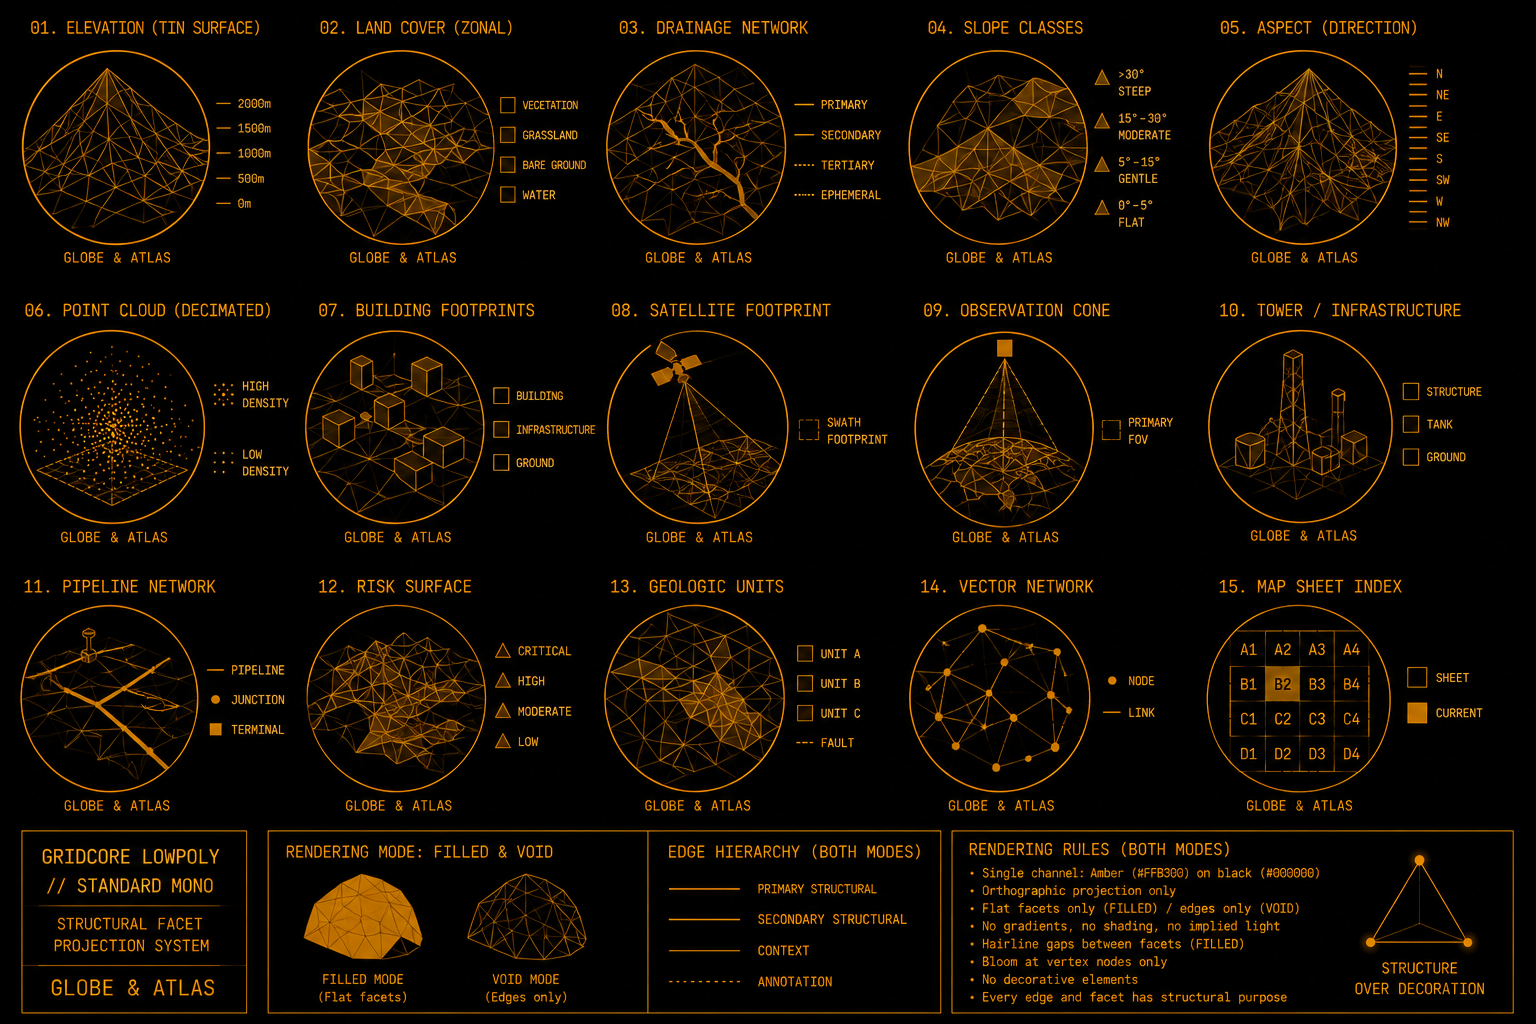
Fifteen studies explore terrain, drainage, buildings, infrastructure, and networks, alongside filled and void rendering modes.
View full-size image ↗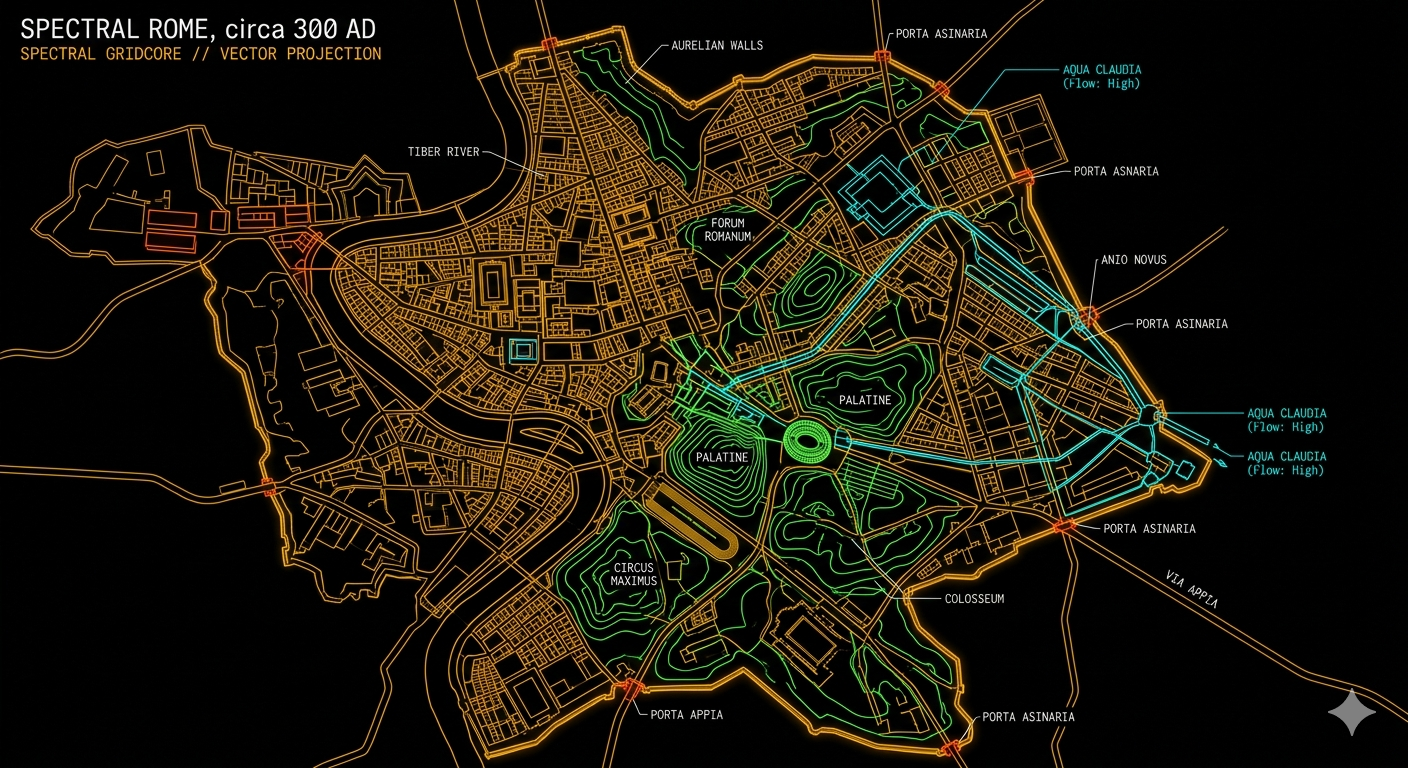
An illustrative city study layers colored channels over an amber street structure. A visual-language experiment, not a historical reconstruction.
View full-size image ↗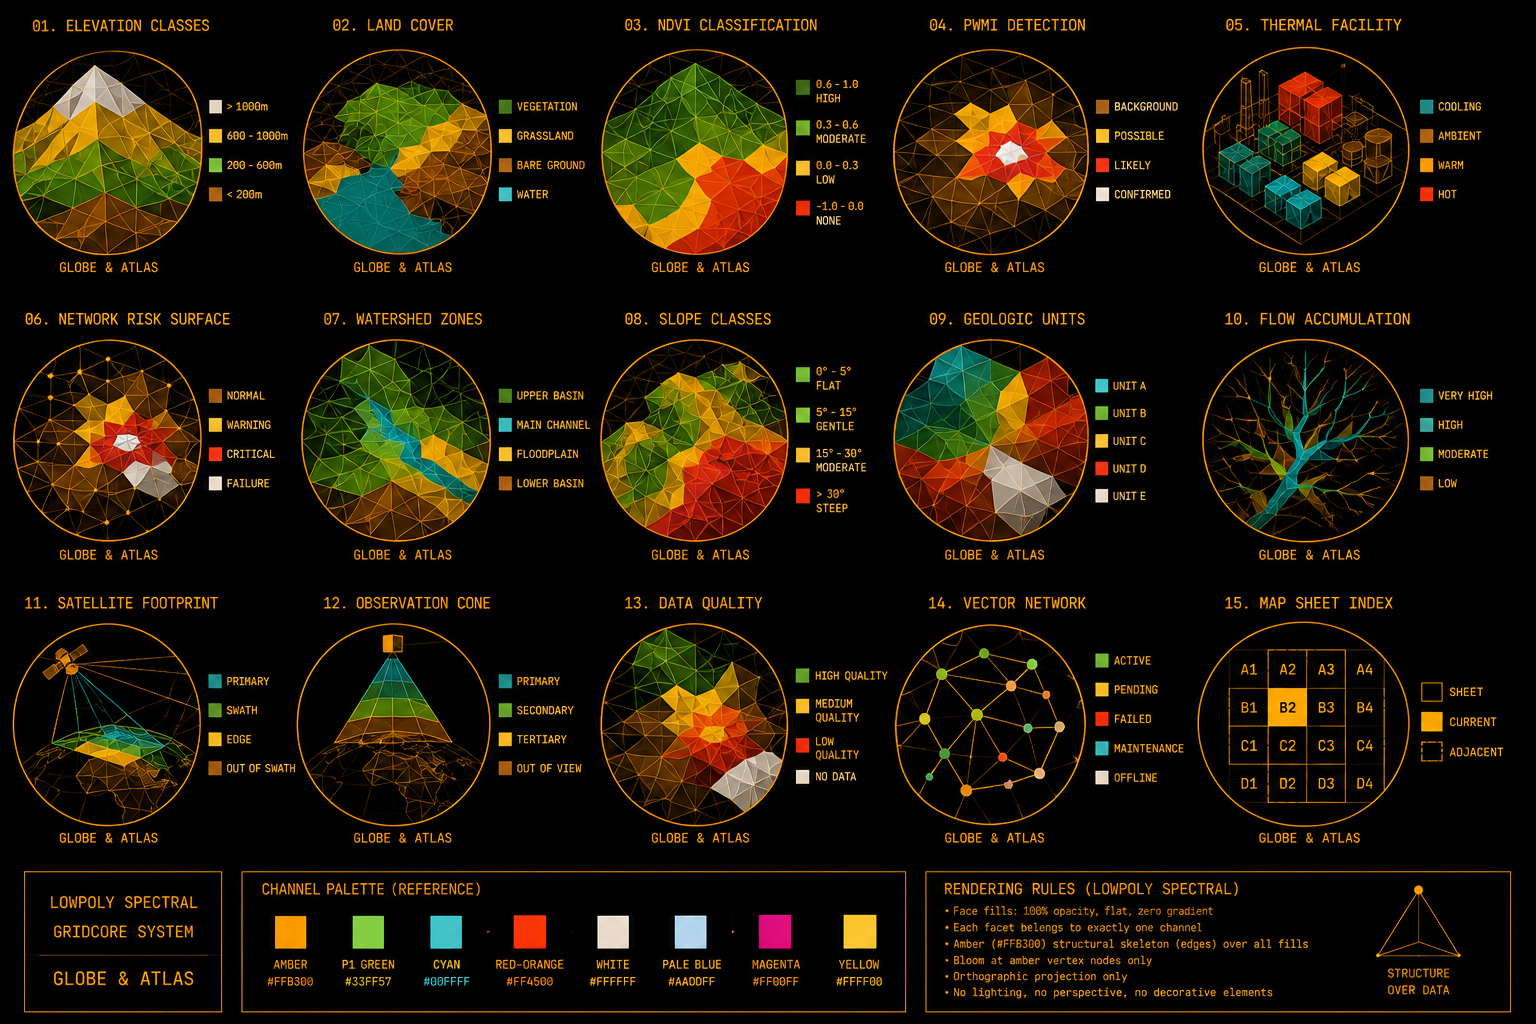
Classified facets explore elevation, land cover, thermal patterns, watersheds, and other possible uses of color as information.
View full-size image ↗Original artwork from the Globe & Atlas Gridcore specification project ↗. Illustrative studies, not measured datasets.
Hollow amber wireframe on absolute black. Every edge describes structure; the space between stays empty.
Read Standard ↗Coarse structural facets, either filled in flat amber or left as open voids. A deliberately different geometric claim.
Read Lowpoly ↗Wireframe structure with declared data channels. Extra colors carry variables, ranges, or classes.
Read Spectral ↗Classified flat facet fills, with amber edges holding the structure together. Each facet belongs to one declared class.
Read Lowpoly Spectral ↗An interactive terrain study lets you compare the modes and their channel declarations. It uses illustrative geometry, not live measurements.
Open the interactive demo ↗